15 Best Infrastructure Monitoring Tools In 2026

Let’s be honest no one thinks about infrastructure monitoring until something breaks. A single sluggish server, a single application crash, or even a single unforeseen outage and it all goes dead. Users become all aggravated, teams begin to scramble and petty problems become full-scale problems before anyone could imagine it.
This is precisely the reason why Infrastructure Monitoring Tools have become a necessity. They will become your 24/7 watchman of your systems that are always monitoring performance, identifying abnormal behavior, and notifying you of when something goes awry. Be it a small start up or a large cloud infrastructure, the proper monitoring tool can save time, money and a lot of stress.
We have selected the 15 best infrastructure monitoring software and included them in this article that will help you remain in control, prevent downtime and ensure that everything runs smoothly. Let us look into that and find one that suits you most.
Key Benefits Of Using Infrastructure Monitoring Platform
- Early problem identification and prevention: Constantly checks the health and performance indicators of the system to detect any possible issues before they become severe failures or downtime.
- Better uptime and service reliability: Ensures your applications, servers, and networks are at your disposal and continue to service at their best which directly reflects on user satisfaction and business continuity.
- Full infrastructure visibility: Provides the centralized perspective of all elements servers, databases, cloud services, containers, and network devices, it is easier to monitor all in one location.
- Accelerated troubling-shooting and root cause analysis: Assists teams in identifying the precise location of a problem swiftly with logs, metrics, and traces and minimizes downtime and reaction time.
- Better resource usage and cost optimization: Helps to learn the usage of CPU, memory and storage, and network usage to optimize resources and eliminate unnecessary cloud or infrastructure charges.
Important Features To Look For In A Monitoring Tool
- Real-time monitoring and intelligent alert: The tool must also enable real-time monitoring with intelligent alerting such that once a threshold is reached, or an anomaly is detected, the team must be able to respond promptly to the performance problems.
- Modern/hybrid environments Support: Should be compatible with modern and hybrid environments (cloud platforms AWS, Azure, GCP), on-premise, containers, and microservices environments.
- Customizable dashboards and visualization: This enables the users to design custom dashboards containing graphs, charts and reports to be able to view the performance of the system at a glance.
- Powerful integration ecosystem: Needs to be incorporated with DevOps tools, CI/CD pipelines, databases, and communication tools (Slack or email) to facilitate workflows.
- Scalability and automation features: The tool must be able to cope with larger infrastructure easily and have automation capabilities such as the auto-discovery, auto-scaling monitoring, and little manual configuration.
List 15 Best Infrastructure Monitoring Tools
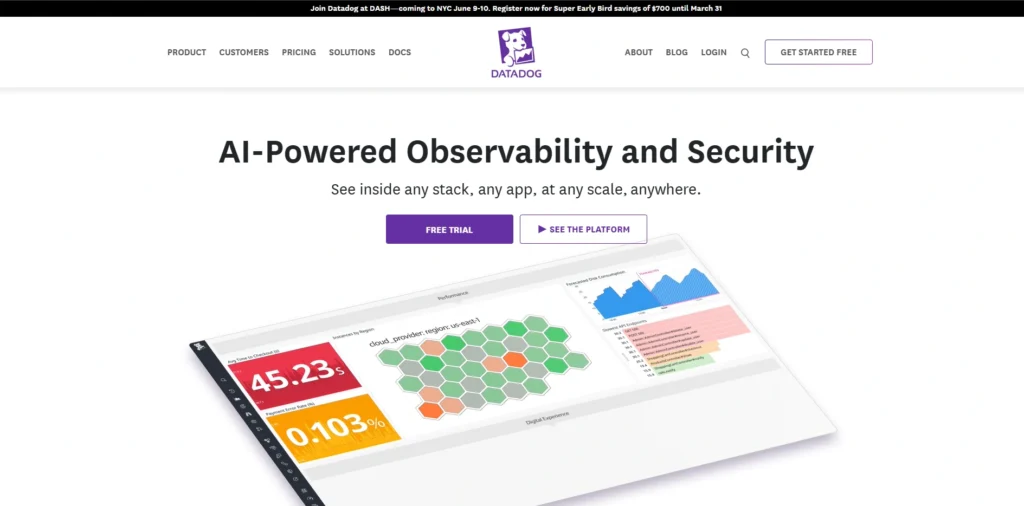
1. Datadog
Website: https://www.datadoghq.com/
Datadog is a leading cloud-based infrastructure monitoring software built for modern, distributed systems and is also one of the best server monitoring tools available today. It provides complete visibility across servers, containers, databases, and applications, making it ideal for teams working in hybrid or multi-cloud environments.
The platform brings together metrics, logs, and traces into a single unified dashboard, allowing teams to quickly identify and resolve performance issues. Its intelligent alerting system uses machine learning to detect anomalies and notify teams before problems escalate.
Top Features:
- Real-time infrastructure and application monitoring
- Log management and distributed tracing
- AI-based anomaly detection
- Custom dashboards and visualization
- Integration with 600+ tools (AWS, Azure, Kubernetes, etc.)
Pros:
- All-in-one platform for metrics, logs, and traces
- Excellent integrations with cloud and DevOps tools
- Powerful real-time dashboards and alerting
Cons:
- Can become expensive as usage grows
- Learning curve for advanced features
- Pricing structure can be complex
Pricing:
| Free | Pro | Enterprise |
| $0 | $15/mo | $23/mo |
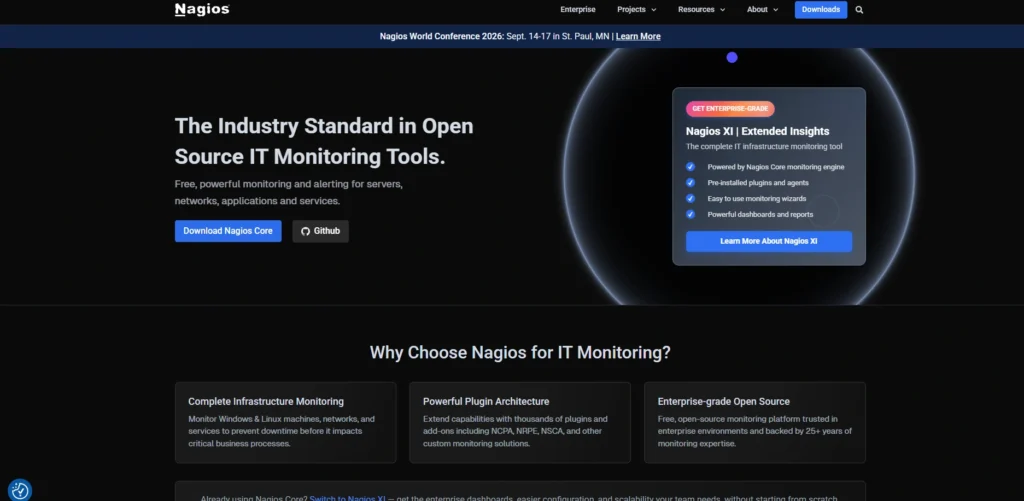
2. Nagios
Website: https://www.nagios.org/
Nagios is a well-known open-source monitoring tool that offers extensive flexibility for tracking infrastructure performance. It is widely used to monitor networks, servers, and applications, especially in environments where customization is important.
The platform provides detailed insights into system health and sends alerts when issues are detected. Although it requires manual configuration, its strong plugin ecosystem and community support make it a reliable choice for organizations that want full control over their monitoring setup.
Top Features:
- Open-source and highly customizable
- Extensive plugin support
- Real-time alerts and notifications
- Network and server monitoring
- Strong community support
Pros:
- Highly customizable with a strong plugin ecosystem
- Open-source and cost-effective
- Large community support
Cons:
- Outdated user interface
- Requires manual setup and configuration
- Limited built-in visualization
Pricing:
- Free
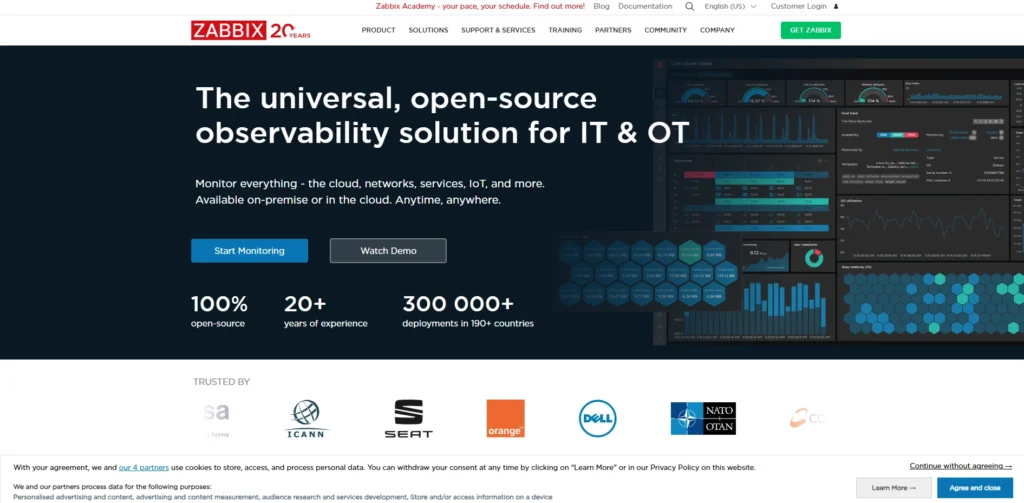
3. Zabbix
Website: https://www.zabbix.com/
Zabbix is an enterprise-grade infrastructure monitoring tools solution designed to track the performance and availability of IT infrastructure components. It supports a wide range of systems, including servers, virtual machines, cloud services, and network devices.
It offers advanced visualization tools, automated alerts, and predictive analytics to help teams detect potential issues early. Its scalability and open-source nature make it suitable for both small organizations and large enterprises.
Top Features:
- Agent-based and agentless monitoring
- Advanced data visualization and reporting
- Predictive problem detection
- Auto-discovery of devices
- Scalable for large environments
Pros:
- Completely open-source with no licensing cost
- Scalable for large enterprise environments
- Strong automation and alerting features
Cons:
- Setup and configuration can be complex
- UI is less modern compared to competitors
- Requires technical expertise to manage
Pricing:
- Available on request
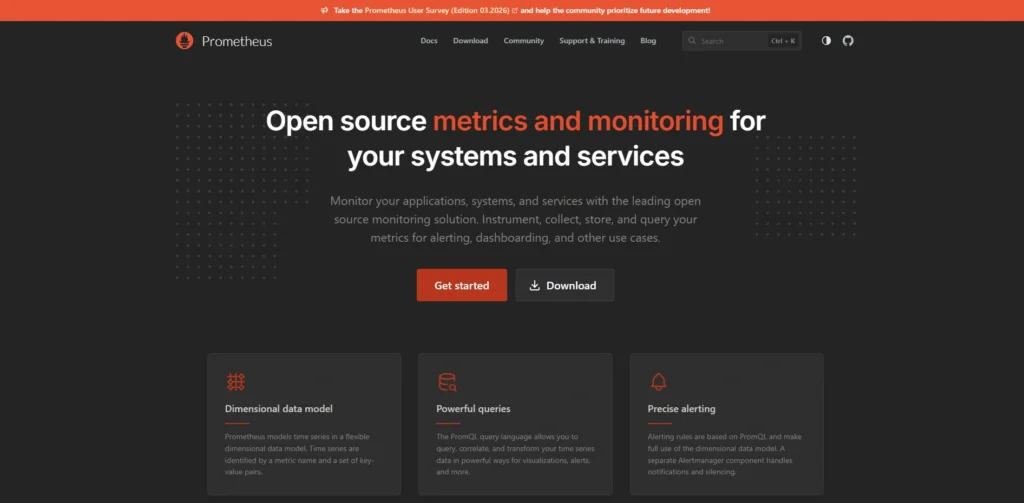
4. Prometheus
Website: https://prometheus.io/
Prometheus is an open-source infrastructure monitoring software and alerting toolkit that is widely used in cloud-native and containerized environments. It is especially popular in Kubernetes ecosystems due to its efficient time-series data handling.
The tool collects metrics from various targets and stores them for analysis using its powerful query language, PromQL. When combined with visualization tools, it provides deep insights into system performance and reliability.
Top Features:
- Powerful time-series database
- PromQL query language
- Kubernetes-native monitoring
- Multi-dimensional data model
- Alerting via Alertmanager
Pros:
- Ideal for cloud-native and Kubernetes environments
- Powerful query language (PromQL)
- Strong community and ecosystem
Cons:
- Limited long-term storage without additional tools
- Not beginner-friendly
- Requires integration with other tools for full observability
Pricing:
- Free
5. Collectd
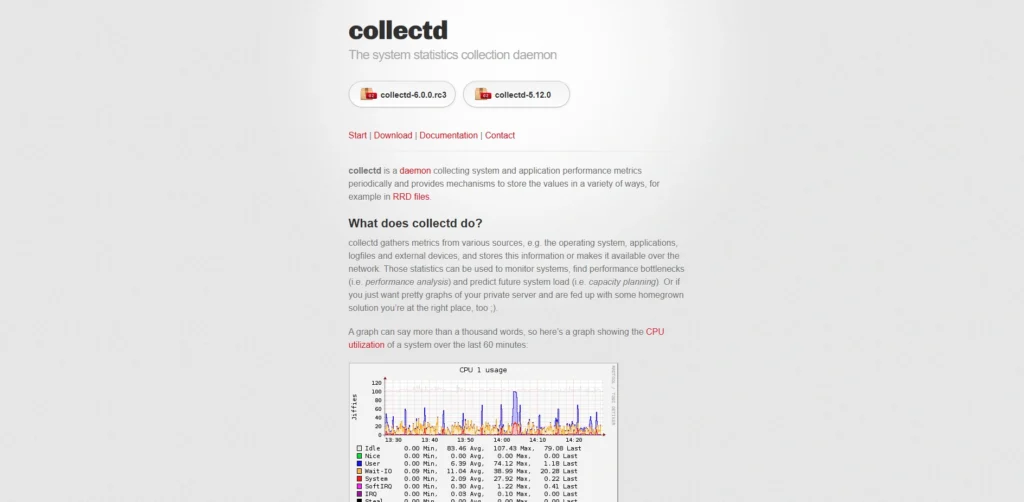
Website:https://collectd.org/
Collectd is a lightweight daemon that gathers system and infrastructure performance metrics. It is designed to collect data from various sources such as CPU, memory, network, and storage systems.
The tool focuses on efficient data collection and supports a wide range of plugins. It is often used as part of a larger monitoring stack to feed metrics into visualization or alerting systems.
Top Features:
- Lightweight and efficient data collection
- Wide range of plugins
- Supports multiple data sources
- High-performance metrics gathering
- Easy integration with monitoring stacks
Pros:
- Lightweight and efficient
- Wide plugin ecosystem
- High-performance data collection
Cons:
- No built-in UI
- Requires integration with other tools
- Limited out-of-the-box features
Pricing:
- Free
6. Microsoft System Center Operations Manager
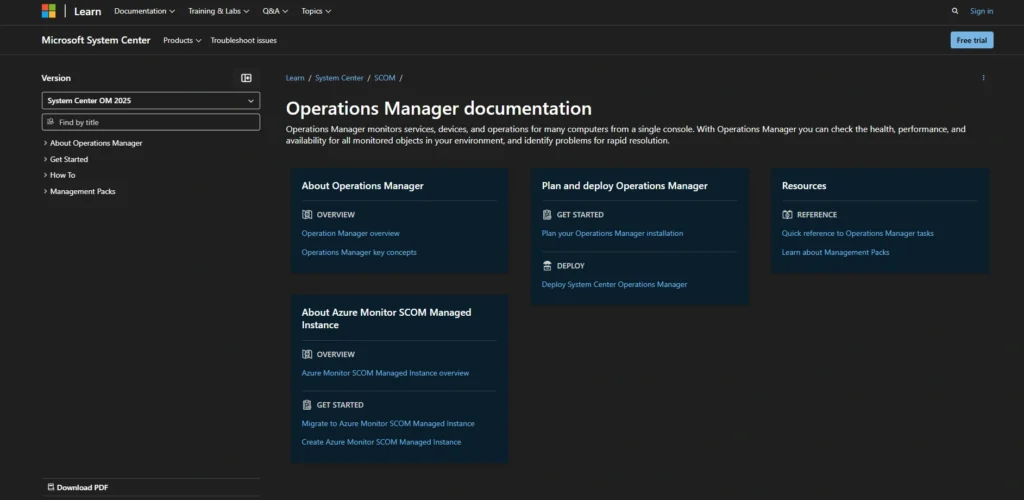
Website: https://learn.microsoft.com/en-us/system-center/scom/
Microsoft System Center Operations Manager (SCOM) is an enterprise-grade infrastructure monitoring tools and application monitoring tools designed for managing large-scale IT environments, especially those based on Windows systems. It provides deep visibility into servers, virtual machines, and applications, ensuring smooth system performance.
The platform uses agents to collect data and offers centralized monitoring with intelligent alerts and reporting. It is highly suitable for organizations that rely on Microsoft technologies and need detailed insights into their infrastructure health.
Top Features:
- Deep monitoring of Windows servers and services
- Centralized dashboard and reporting
- Intelligent alerting system
- Integration with Microsoft ecosystem
- Scalable for enterprise environments
Pros:
- Deep integration with Microsoft ecosystem
- Strong monitoring for Windows environments
- Centralized management and reporting
Cons:
- Limited for non-Microsoft environments
- Complex setup
- Licensing cost
Pricing:
- Available on request
7. VMware vRealize
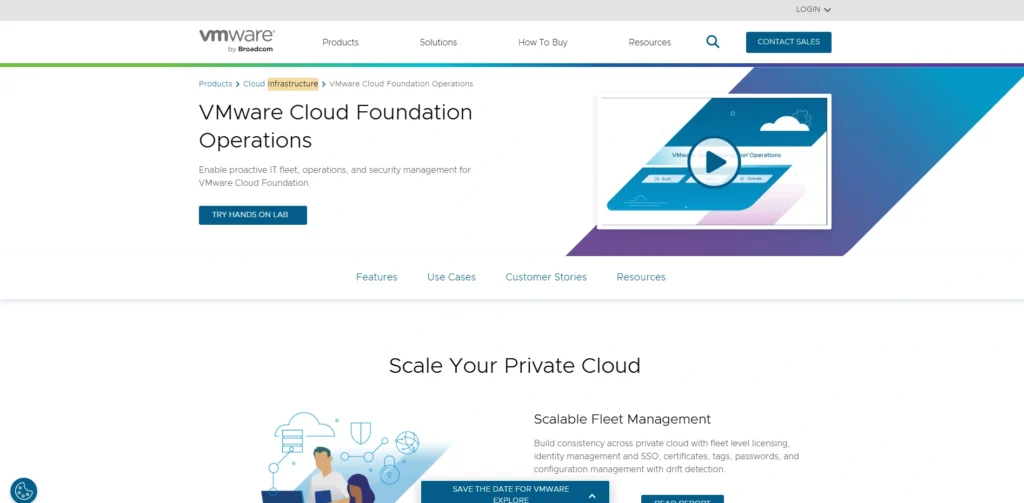
Website: https://www.vmware.com/products/vrealize-operations.html
VMware vRealize is a powerful infrastructure monitoring software designed for virtualized and cloud environments. It provides comprehensive visibility into VMware-based infrastructure, including virtual machines, storage, and networks.
The tool uses predictive analytics and automation to optimize performance and prevent issues before they occur. It is ideal for organizations heavily using VMware technologies and looking to improve efficiency and capacity planning.
Top Features:
- Monitoring for virtualized and cloud infrastructure
- Predictive analytics and capacity planning
- Automated performance optimization
- Custom dashboards and reporting
- Integration with VMware ecosystem
Pros:
- Excellent for virtualized environments
- Predictive analytics and automation
- Strong VMware integration
Cons:
- Expensive
- Limited outside VMware ecosystem
- Requires training
Pricing:
- Available on request
8. LogicMonitor
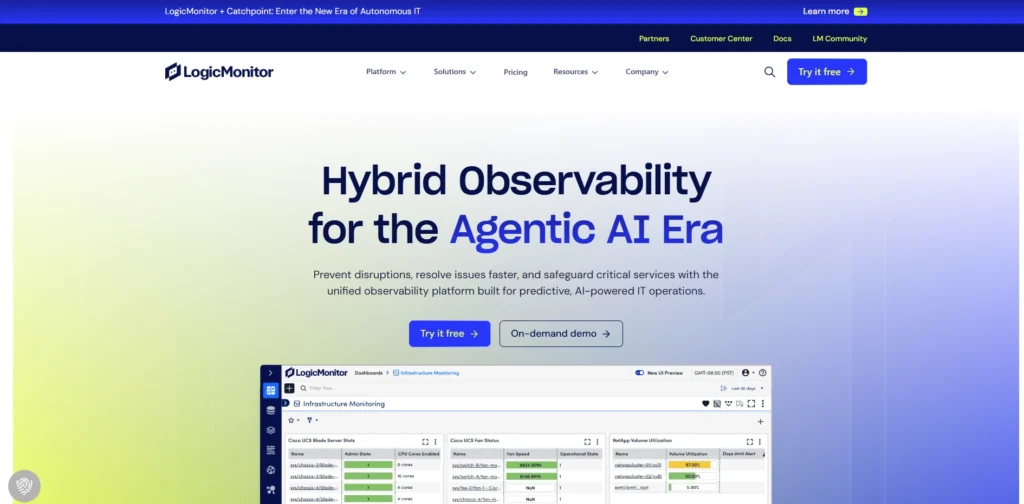
Website: https://www.logicmonitor.com/
LogicMonitor is a cloud-based infrastructure monitoring tools that provides end-to-end visibility across networks, servers, applications, and cloud environments. It is known for its ease of deployment and scalability.
The platform uses automated discovery to identify resources and start monitoring them instantly. Its intelligent alerting and reporting capabilities help teams maintain uptime and ensure optimal performance.
Top Features:
- Automated infrastructure discovery
- Cloud and hybrid environment monitoring
- Intelligent alerting system
- Custom dashboards and reporting
- Wide integration support
Pros:
- Easy deployment with automated discovery
- Strong support for hybrid environments
- Scalable SaaS-based solution
Cons:
- Premium pricing
- Limited customization compared to open-source tools
- Interface can feel complex initially
Pricing:
| Essential | Advanced | Signature |
| $16/mo | $27/mo | $53/mo |
9. Opsview
Website: https://www.opsview.com/
Opsview is a scalable infrastructure monitoring solution designed to provide visibility across servers, networks, cloud environments, and applications. It is built on Nagios but enhanced with a modern interface and enterprise-ready capabilities.
The platform offers centralized monitoring, automation, and flexible deployment options, making it suitable for both mid-sized businesses and large enterprises. Its ability to monitor hybrid infrastructure ensures consistent performance across different environments.
Top Features:
- Comprehensive infrastructure monitoring
- Centralized dashboards and reporting
- Scalable for large environments
- Integration with cloud and on-premise systems
- Built on Nagios core with enhancements
Pros:
- Built on Nagios with improvements
- Scalable for enterprise use
- Centralized monitoring and dashboards
Cons:
- Paid versions required for advanced features
- Setup can be complex
- Smaller ecosystem compared to competitors
Pricing:
- Available on request
10. Centreon
Website: https://www.centreon.com/
Centreon is a comprehensive IT infrastructure monitoring platform built to provide visibility into complex systems. It supports monitoring of servers, networks, cloud environments, and applications from a unified interface.
The platform offers advanced analytics, automation, and customizable dashboards. Its strong performance and scalability make it suitable for enterprise-level infrastructure monitoring.
Top Features:
- Unified infrastructure monitoring
- Advanced analytics and reporting
- Custom dashboards and alerts
- Scalable architecture
- Integration with multiple data sources
Pros:
- Strong enterprise monitoring capabilities
- Modern interface with advanced analytics
- Built on Nagios with enhancements
Cons:
- Setup can be complex
- Enterprise features are paid
- Requires expertise to configure
Pricing:
| IT Edition | Pro Edition |
| $489.60/mo | $1296/mo |
11. Netdata
Website: https://www.netdata.cloud/
Netdata is a lightweight, real-time infrastructure monitoring software that provides detailed insights into system performance. It is designed to monitor servers, containers, and applications with minimal setup and high efficiency.
The platform offers instant visibility with auto-configured dashboards and zero-configuration monitoring. Its real-time alerts and detailed metrics make it a great choice for teams looking for quick and actionable insights.
Top Features:
- Real-time monitoring with high granularity
- Auto-configuration and easy setup
- Lightweight and efficient performance
- Detailed system metrics and visualization
- Built-in alerting system
Pros:
- Real-time high-resolution monitoring
- Easy setup and auto-configuration
- Lightweight and fast
Cons:
- Limited enterprise features
- Requires additional tools for long-term analysis
- UI may feel overwhelming
Pricing:
- Available on request
12. Pandora FMS
Website: https://pandorafms.com/en/server-monitoring/
Pandora FMS is a comprehensive infrastructure monitoring tools designed to track the performance and availability of IT systems, including servers, networks, applications, and cloud environments. It offers both agent-based and agentless monitoring, making it highly flexible for different infrastructure setups.
The platform provides centralized monitoring with advanced alerting, reporting, and automation features. Its scalability and wide range of supported technologies make it suitable for organizations managing complex and distributed infrastructure.
Top Features:
- Agent-based and agentless monitoring
- Centralized dashboard and reporting
- Real-time alerts and notifications
- Supports cloud, network, and server monitoring
- Scalable for large infrastructures
Pros:
- Supports both agent and agentless monitoring
- Covers servers, network, and cloud infrastructure
- Scalable for complex environments
Cons:
- Interface can feel outdated
- Setup requires technical knowledge
- Some advanced features are paid
Pricing:
| Free | One | Corporate | MSP |
| $0 | $2709.50/yr | Custom | $0.56/agent |
13. Sensu
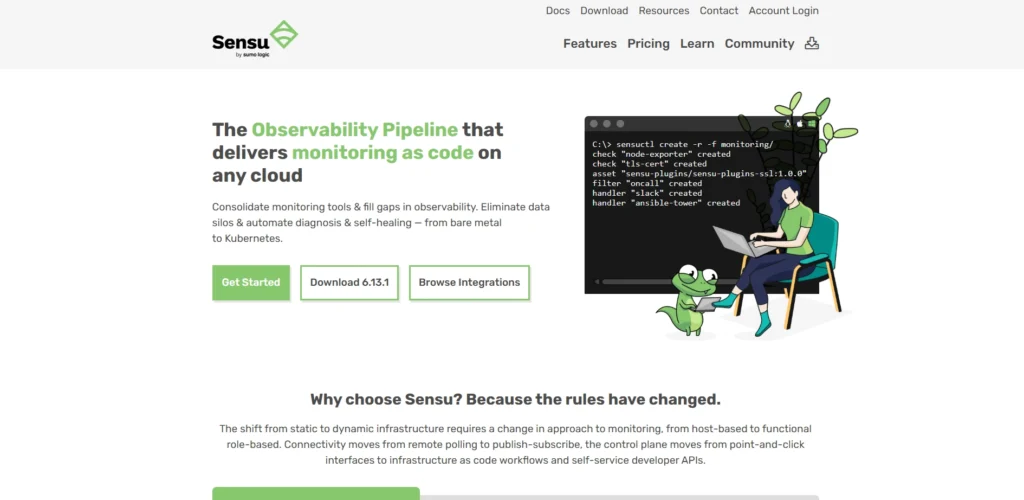
Website: https://sensu.io/
Sensu is a flexible infrastructure monitoring software designed for dynamic and cloud-native environments. It enables organizations to monitor servers, containers, and services across hybrid infrastructures.
The platform supports automation and integrates well with modern DevOps workflows. Its scalability and flexibility make it suitable for complex and distributed systems.
Top Features:
- Monitoring for hybrid and cloud-native infrastructure
- Automation-friendly architecture
- Integration with DevOps tools
- Scalable and flexible deployment
- Event-driven monitoring system
Pros:
- Flexible and scalable architecture
- Great for cloud-native environments
- Strong automation support
Cons:
- Setup complexity
- Smaller community
- Requires DevOps knowledge
Pricing:
| Free | Pro | Enterprise |
| $0 | $3/mo | $5/mo |
14. Icinga
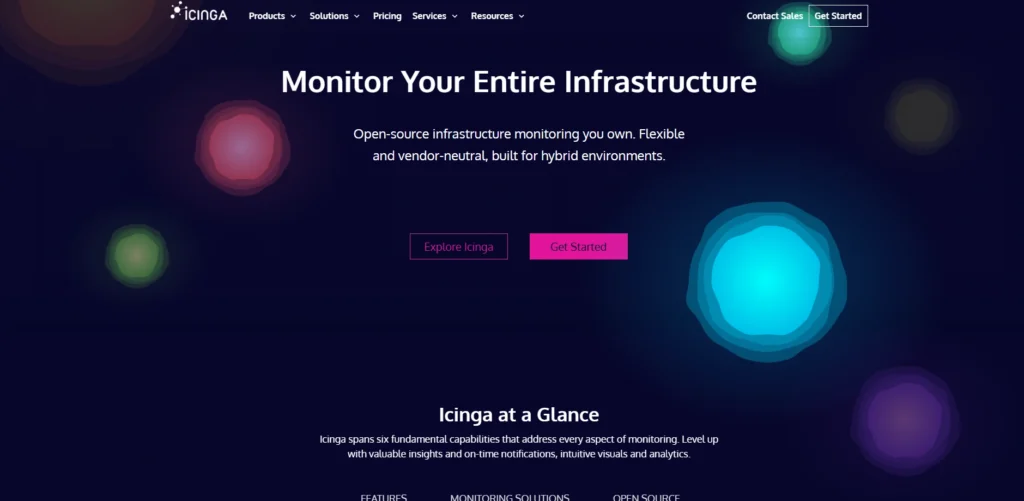
Website: https://icinga.com/
Icinga is an open-source monitoring tools designed to provide comprehensive insights into infrastructure health and performance. It evolved from Nagios and offers enhanced scalability and a modern interface.
The platform supports monitoring of networks, servers, and applications while providing flexible configuration options. Its extensibility and strong community make it a reliable choice for organizations seeking open-source alternatives.
Top Features:
- Open-source and highly extensible
- Real-time monitoring and alerting
- Modern web interface
- Integration with various plugins
- Scalable architecture
Pros:
- Open-source and highly extensible
- Modern interface compared to Nagios
- Strong plugin support
Cons:
- Requires technical expertise
- Setup can be time-consuming
- Smaller community than some competitors
Pricing:
- Free
15. Checkmk
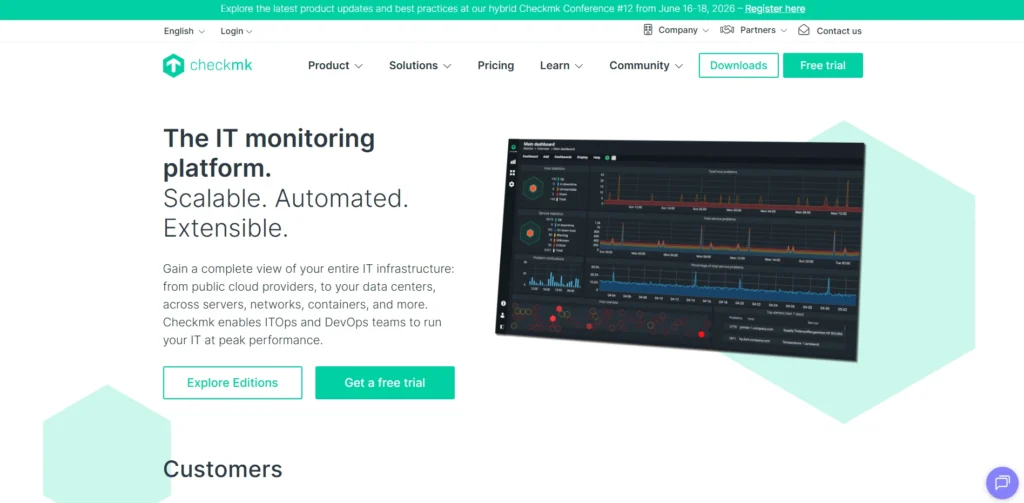
Website: https://checkmk.com/
Checkmk is a comprehensive IT monitoring solution designed to simplify infrastructure monitoring across complex environments. It supports monitoring of servers, networks, cloud services, and applications from a single platform.
The tool offers both open-source and enterprise editions, providing flexibility for different organizational needs. Its automation features and efficient data handling make it easy to manage large-scale infrastructures.
Top Features:
- Automated service discovery
- Scalable monitoring for large environments
- Cloud, network, and server monitoring
- Customizable dashboards and alerts
- Open-source and enterprise versions available
Pros:
- Excellent automation and scalability
- Supports large and complex infrastructures
- Available in both open-source and enterprise versions
Cons:
- Learning curve for beginners
- Advanced features require enterprise edition
- Interface may feel complex initially
Pricing:
| Free | Pro | Ultimate | Ultimate with multi- tenency |
| $0 | $275/mo | $400/mo | $425/mo |
Comparison Table
| Tool Name | Type | Deployment | Best For | Key Strength | Ease of Use | Scalability | Open Source |
| Datadog | Full-stack infrastructure monitoring | Cloud | Modern cloud infra | Unified observability | Easy | High | No |
| Nagios | Infrastructure monitoring | On-premise | Custom setups | Highly customizable | Moderate | Medium | Yes |
| Zabbix | Enterprise infrastructure monitoring | On-premise/Cloud | Enterprise IT | Scalable and flexible | Moderate | High | Yes |
| Prometheus | Monitoring toolkit | Cloud-native | Kubernetes infra | Powerful metrics | Moderate | High | Yes |
| Icinga | Infrastructure monitoring | On-premise | Open-source users | Flexible architecture | Moderate | High | Yes |
| Checkmk | IT monitoring | On-premise/Cloud | Large infra | Automation | Moderate | High | Yes |
| LogicMonitor | SaaS monitoring | Cloud | Hybrid infra | Auto-discovery | Easy | High | No |
| Centreon | Infrastructure monitoring | On-premise/Cloud | Enterprise infra | Advanced analytics | Moderate | High | Yes |
| Microsoft SCOM | Infrastructure monitoring | On-premise | Windows environments | Deep MS integration | Moderate | High | No |
| VMware vRealize Ops | Infrastructure monitoring | Cloud/On-premise | Virtualized infra | Predictive analytics | Moderate | High | No |
| Netdata | Real-time monitoring | On-premise/Cloud | Real-time insights | High-resolution metrics | Easy | Medium | Yes |
| Sensu | Infrastructure monitoring | Cloud/On-premise | Cloud-native infra | Event-driven monitoring | Moderate | High | Yes |
| Collectd | Metrics collection | On-premise | System stats | Lightweight | Moderate | High | Yes |
| Opsview | Infrastructure monitoring | On-premise/Cloud | Enterprise infra | Nagios-based | Moderate | High | No |
| Pandora FMS | Infrastructure monitoring | On-premise/Cloud | Complex infra | Agent flexibility | Moderate | High | Yes |
Conclusion
In conclusion, the selection of the appropriate Infrastructure Monitoring Tools is not only about performance monitoring but also about maintaining your own system stable, reliable and able to meet the requirements set by the real world. It is so that, with such a large variety of tools, the most appropriate one would be contingent upon your needs, be it cloud monitoring, network visibility, or full-stack observability.
The list of the tools described in this article is quite extensive, as it includes open-source tools, as well as enterprise-level resources. When you are just getting started, it is possible to use flexible and affordable alternatives, and more massive companies might require AI-based and automated surveillance devices. Ultimately, a good monitoring tool will cost you less to invest in and will provide you with fewer surprises, quicker resolution of issues, and a better experience to your team and your users.
FAQs
1. Why Is Infrastructure Monitoring Software Important?
It helps detect issues early, reduces downtime, improves system performance, and ensures a better user experience by keeping systems stable and reliable.
2. What is The Difference Between Monitoring And Observability?
Monitoring focuses on collecting and tracking predefined metrics, while observability goes deeper by helping you understand why an issue is happening using logs, metrics, and traces.
3. Are Open-Source Monitoring Tools Reliable?
Yes, many open-source tools like Nagios, Zabbix, and Prometheus are highly reliable and widely used. However, they may require more setup and maintenance compared to paid tools.
4. Which Monitoring Tool Is Best For Beginners?
Tools like PRTG, ManageEngine OpManager, and Datadog are considered beginner-friendly due to their easy setup, user-friendly dashboards, and strong documentation.
5. Can One Tool Monitor Both Cloud Cnd On-Premise Infrastructure?
Yes, most modern monitoring tools support hybrid environments, allowing you to monitor both cloud-based and on-premise systems from a single platform.
