
You took your time to search for the data, hired a designer and tinkered with all the icons. The infographic is really awesome. Then you post it on your blog, once on social media, and everything remains still. Sound familiar? It’s not usually a design problem. It is distribution.
An infographic submission site is only valuable when it’s being seen by the right people, and infographic directories, visual platforms and curated galleries are the way to get that done. The right placement can lead to referral traffic, in addition to blogger and journalist mentions, image searches and, in the best-case scenarios, actual editorial links.
It’s not the same game as in 2026 – it isn’t the ‘submit to 100 directories’ game at all. Google can identify spammy link patterns, and countless platforms have implemented the nofollow attribute; in addition, certain popular galleries have gradually shut down. This guide provides you with an accurate and current snapshot. You will discover which platforms are worth your time, how free and paid platforms compare, where dofollow links are still found and which platforms you can use to do it like a pro. Let’s get started.
What Are Infographic Submission Sites?
Infographic Submission Sites are websites, directories and community platforms where you upload an infographic along with a title, description and a link back to your page. Some are editorial galleries that require a human editor to vet your content before it’s published. Some are platforms that allow you to make a profile and post.
The idea is straightforward: generate more viewers of your visual material. With each listing, they can bring traffic, create brand awareness and establish a backlink that leads to your original article. Consider them shop windows for your design. The more attractive the window, the more interesting the street; the more passers-by stop to view.
How Infographic Submission Works
Infographic submission is an easy way to share your images on different websites and reach more people. Here is how you can do it:
- Create an infographic: Make a simple and attractive image with useful information, facts, or tips.
- Find suitable websites: Choose platforms that accept infographics related to your topic.
- Write a title and description: Add a short title and explain what your infographic is about.
- Upload your image: Submit the infographic by following the website’s instructions.
- Add your website link: If the platform allows it, include a link to your blog or website.
- Check the submission rules: Make sure your image follows the website’s guidelines.
- Track the results: Check whether your infographic brings visitors, shares, or backlinks to your website.
The best approach is to share useful, original infographics on relevant websites. This helps more people discover your content and can support your SEO efforts over time.
Do Infographic Submission Sites Still Work for SEO in 2026?
Yes, but used for a different purpose. The days of mass submission of raw links have been long gone, and Google has stated that low-value schemes can be ignored or penalized. That which remains relevant and quality is still working. Everything is basically a single listing on a preferred gallery or a reference in a specific blog can outshine half a dozen throwaway profiles.
The real SEO juice is obtained from “indirect” signals like referral visits, branded searches, image search impressions, and by allowing a writer to find your visual and link to it naturally. The first priority for submissions is promotion, and the second is link building—and you’ll find better results.
What changed in 2026
- AI-generated summaries: Now answer a lot of questions directly, and original data and unique visuals will play an even bigger part in attracting clicks and citations.
- Image search and visual discovery: Continue to evolve, and descriptive file names, alt text, and captions are more valuable than ever.
- Link spam detection: Stronger patterns like the same description on numerous weak links are easier to see and disregard.
- Editorial standards: Have improved. Galleries and bloggers get more submissions, and they don’t accept clichés. Galleries and bloggers get more submissions, and they don’t accept clichés.
- Brand mentions: Links are optional, but they still make a difference. Familiarity is built through being cited, saved and shared, leading to branded searches over time.
Benefits of Using Infographic Submission Sites
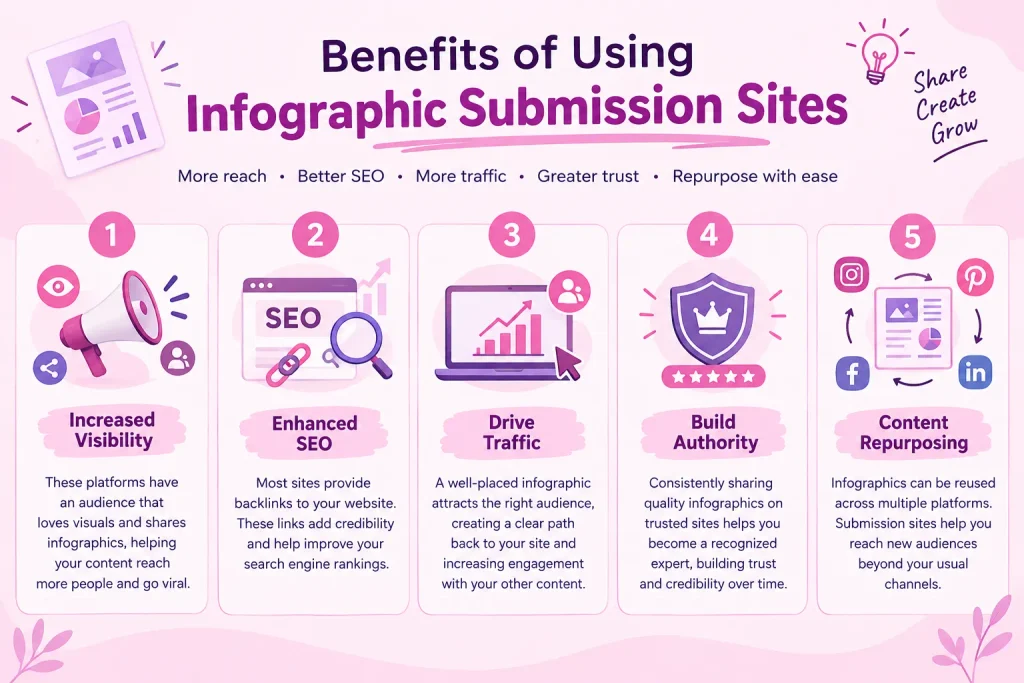
Before diving into specific submission sites, it’s important to understand why submitting infographics is beneficial:
Increased Visibility:
Most of the above-mentioned sites have an audience that targets visuals and shares infographics as a result. Sharing your infographic on these platforms also brings it out there for people to see, hence the increased rate at which it can go viral.
Enhanced SEO:
Actually, many infographic submission sites provide backlinks to your website. They are also good for SEO because the links from such a site add credibility to your site and increase its ranking in the search engine results pages.
Drive Traffic:
One can attract a great deal of traffic through a perfectly chosen and placed infographic. This way, you create a kind of route that viewers have to follow to go back to your site and interact with other content provided.
Build Authority:
Consequently, the consistent production and submission of quality infographics on well-known sites creates a reputation for an expert in the given field. This puts your firm in a position of trust and credibility within the industry; over time, results will improve.
Content Repurposing:
That is how visuals are built, and infographics can be later utilized across different platforms. While most of the time people post content that is useful in similar situations, submission sites offer another method that connects this content to viewers you would not get otherwise.
Dofollow vs Nofollow: What We Found on Each Site
| Platform | Type | Typical Link Status | Notes |
| Visual network | Nofollow | Great for traffic and saves | |
| Behance | Creative portfolio | Nofollow | Strong design audience |
| SlideShare | Presentation hub | Nofollow | Works well for PDF versions |
| Scribd | Document library | Nofollow | Good for long-tail discovery |
| Reddit (r/infographics) | Community | Nofollow | Needs genuine participation |
| Flickr | Image sharing | Nofollow | Useful for image search |
| Imgur | Image hosting | Nofollow | Fast viral potential |
| Dribbble | Design showcase | Nofollow | Best for designers |
| Medium | Publishing | Nofollow (mostly) | Embed infographic in a post |
| Editorial infographic blogs | Curated galleries | Varies | Often the best chance of a followed link |
| Niche industry blogs | Editorial | Varies | Earned mentions can be dofollow |
Where Paid Submissions Cross Google’s Link-Spam Line
Paying for guaranteed links
Google’s spam policies consider buying links that pass linking juice to be a violation. Any service guaranteeing a “50 dofollow backlinks in 7 days” for a price tag is a red flag. It’s okay to be paid to be exposed; it’s dangerous to be paid to have ranking power.
Undisclosed sponsored placements
When money, value or other exchanges are made with a feature, it should include a sponsored or nofollow attribute on the link. That relationship is what many publishers and brands stumble on when they try to hide it from readers and search engines.
Networks of identical listings
If you are spamming the same blog post, description, and anchor text over a bunch of crappy blogs, it is easy to tell. If all of the sites are free, the pattern appears to be manipulative. Quality, variety and relevance will keep you on the right side.
Top Infographic Submission Sites at a Glance (Comparison Table)
The Domain Rating (DR) bands are approximate and vary on a monthly basis. Double-check in Ahrefs before publishing.
| Site | Cost | Link Type | Approx. DR Band | Approval | Best For |
| Free | Nofollow | Very high (90+) | Instant | Traffic and saves | |
| Behance | Free | Nofollow | Very high (90+) | Instant | Designers, agencies |
| SlideShare | Free | Nofollow | Very high (90+) | Instant | Presentations |
| Scribd | Free | Nofollow | High (85+) | Instant | PDF distribution |
| Free | Nofollow | Very high (90+) | Instant | Community feedback | |
| Flickr | Free | Nofollow | Very high (90+) | Instant | Image search |
| Imgur | Free | Nofollow | High (85+) | Instant | Viral sharing |
| Dribbble | Free | Nofollow | High (85+) | Instant/Invite | Design showcase |
| Medium | Free | Nofollow | Very high (90+) | Instant | Storytelling |
| Editorial infographic galleries | Free/Paid | Varies | Low to mid | 1 to 14 days | Real backlinks |
| Niche industry blogs | Free/Paid | Varies | Low to high | Varies | Targeted audiences |
Best Free Infographic Submission Sites
| Sr. No | Free Infographic Submission Sites List | DA | Spam Score |
|---|---|---|---|
| 1 | https://www.pinterest.com | 94 | 7 |
| 2 | https://www.slideshare.net | 94 | 3 |
| 3 | https://www.reddit.com/r/infographics | 92 | 3 |
| 4 | https://www.facebook.com | 96 | 1 |
| 5 | https://www.twitter.com | 95 | 31 |
| 6 | http://photobucket.com | 93 | 20 |
| 7 | https://www.myspace.com | 95 | 9 |
| 8 | https://www.behance.net | 92 | 1 |
| 9 | https://infographicbee.com | 30 | 0 |
| 10 | https://www.infographicsite.com | 32 | 1 |
| 11 | https://infographicplaza.com | 27 | 1 |
| 12 | https://www.infographixdirectory.com | 32 | 4 |
| 13 | https://visme.co/blog | 74 | 1 |
| 14 | https://www.easel.ly/blog | 66 | 3 |
| 15 | https://www.venngage.com/blog | 77 | 1 |
| 16 | https://piktochart.com/blog | 84 | 1 |
| 17 | https://www.visual.ly | 87 | 4 |
| 18 | https://www.flickr.com | 92 | 17 |
| 19 | https://infographiclove.com | 26 | 3 |
| 20 | https://dailyinfographic.com | 79 | 3 |
| 21 | https://www.infographicsarchive.com | 51 | 1 |
| 22 | https://coolinfographics.com | 59 | 8 |
| 23 | https://www.infographicsmania.com | 46 | 5 |
| 24 | https://infographiclist.com | 45 | 1 |
| 25 | myspace.com | 95 | 9 |
| 26 | twitter.com | 95 | 31 |
| 27 | photobucket.com | 93 | 20 |
| 28 | instagram.com | 94 | 1 |
| 29 | livejournal.com | 59 | 1 |
| 30 | dribbble.com | 92 | 7 |
| 31 | reddit.com | 92 | 3 |
| 32 | https://flowingdata.com | 83 | 2 |
| 33 | https://infographicpost.com | 30 | 0 |
| 34 | https://www.visualistan.com | 58 | 5 |
| 35 | https://www.infographicsking.com | 25 | 8 |
| 36 | https://www.infographicportal.com | 35 | 2 |
| 37 | https://infographiclabs.com | 42 | 1 |
| 38 | fastcompany.com | 92 | 1 |
| 39 | business2community.com | 89 | 1 |
| 40 | visual.ly | 87 | 4 |
| 41 | cutewriters.com | 55 | 6 |
| 42 | best-infographics.com | 44 | 1 |
| 43 | infographicsarchive.com | 51 | 1 |
| 44 | ilovecharts.tumblr.com | 50 | 3 |
| 45 | datavisualization.ch | 51 | 1 |
| 46 | xplane.com | 51 | 2 |
| 47 | flowingdata.com | 83 | 2 |
| 48 | dailyinfographic.com | 79 | 3 |
| 49 | infogram.com | 82 | 1 |
| 50 | mobypicture.com | 81 | 6 |
| 51 | good.is | 78 | 1 |
| 52 | infogr.am | 78 | 0 |
| 53 | designyoutrust.com | 67 | 1 |
| 54 | elearninginfographics.com | 58 | 2 |
| 55 | infographicjournal.com | 55 | 1 |
| 56 | visualizing.org | 55 | 0 |
| 57 | nowsourcing.com | 53 | 1 |
| 58 | infographicsshowcase.com | 48 | 11 |
| 59 | infographicportal.com | 35 | 2 |
| 60 | nerdgraph.com | 40 | 28 |
| 61 | bestinfographics.co | 41 | 0 |
| 62 | infographiclabs.com | 42 | 1 |
| 63 | infographicbee.com | 30 | 0 |
| 64 | submitinfographics.com | 40 | 0 |
| 65 | loveinfographics.com | 40 | 1 |
| 66 | newsilike.in | 35 | 2 |
| 67 | infographicsmania.com | 46 | 5 |
| 68 | infocarnivore.com | 36 | 0 |
| 69 | infographicsite.com | 32 | 1 |
| 70 | onlyinfographic.com | 35 | 6 |
| 71 | shithot.co.uk | 35 | 1 |
| 72 | infographicsonly.com | 32 | 2 |
| 73 | infographixdirectory.com | 32 | 4 |
| 74 | pdviz.com | 30 | 1 |
| 75 | infographicplaza.com | 27 | 1 |
| 76 | infographicsposters.com | 30 | 14 |
| 77 | amazinginfographics.com | 30 | 7 |
| 78 | allinfographics.org | 28 | 4 |
| 79 | thedinfographics.com | 28 | 2 |
| 80 | revuwire.com | 29 | 7 |
| 81 | infographicpost.com | 30 | 0 |
| 82 | gifographics.co | 30 | 2 |
| 83 | videoinfographic.com | 23 | 9 |
| 84 | infographicdatabase.com | 23 | 44 |
| 85 | infographicsking.com | 25 | 8 |
| 86 | pureinfographics.com | 16 | 41 |
| 87 | infographicas.com | 25 | 24 |
| 88 | infographicreviews.com | 14 | 4 |
| 89 | latestinfographics.com | 19 | 9 |
| 90 | interestpin.com | 28 | 9 |
| 91 | lkrllc.com | 14 | 7 |
| 92 | submitvisuals.com | 17 | 7 |
| 93 | articles.h1ad.com | 24 | 5 |
| 94 | todayinfographic.com | 14 | 13 |
| 95 | 23hq.com | 58 | 13 |
| 96 | datagraphie.com | 11 | 3 |
| 97 | fotothing.com | 55 | 16 |
| 98 | vk.com | 96 | 1 |
| 99 | advertiseera.com | 21 | 13 |
| 100 | story.wallclassifieds.com | 25 | 3 |
| 101 | blog.giganticlist.com | 25 | 6 |
| 102 | article.classifiedsfactor.com | 25 | 0 |
| 103 | smugmug.com | 52 | 1 |
| 104 | soup.io | 38 | 1 |
| 105 | evernote.com | 92 | 4 |
| 106 | indulgy.com | 60 | 5 |
| 107 | smore.com | 82 | 1 |
| 108 | depositfiles.com | 92 | 16 |
| 109 | uploadfiles.io | 56 | 4 |
| 110 | pexels.com | 93 | 5 |
Paid Infographic Submission Sites: Are They Worth It?
Paid list inclusion works when you pay for exposure, not for guaranteed links.
- Consideration: Sponsored posts on credible niche blogs with actual readers and that are clearly marked as sponsored content.
- To consider: Marketplaces or promotion services that get your work in front of editors.
- Watch out for: bulk packages that are really “dozens of dofollow links” for very cheap.
- Beware of the following: sellers who don’t mention site names or don’t provide real-life examples of their placements.
- Smart test: Do you think you’d pay if the link had the nofollow attribute? If yes, the audience is worth it.
Pro tips to earn real editorial links
- Use original data: A survey, a fresh analysis or a clever comparison provides writers a justification for quoting you instead of a competitor.
- Make it embeddable: put a link back to your host page in every embed, which can include a credit link.
- Give a brief description: Editors are on a tight schedule. Provide them with 3 statistics, a paperless caption and let them work their magic!
- Time it right: Publish infographics that may have a seasonality or a trend a few weeks before they’re peaking, when bloggers are thinking of content.
- Make outreach personal: Reference a recent article written by the editor and why your graphic is an ideal match for your readers.
- Refresh winners: Make a new infographic every year with new data and re-post it. Relevant and updated information gets new visibility and new links.
Social and Visual Platforms to Distribute Infographics
| Sr No | URL | Best Use Case |
|---|---|---|
| 1 | https://www.pinterest.com/ | Infographic pins, evergreen discovery, blog referral traffic |
| 2 | https://www.instagram.com/ | Infographic carousels, brand awareness, audience engagement |
| 3 | https://www.facebook.com/ | Business pages, niche groups, community sharing |
| 4 | https://www.linkedin.com/ | B2B infographics, industry statistics, research reports |
| 5 | https://www.reddit.com/ | Niche communities, data-driven discussions, audience reach |
| 6 | https://x.com/ | Research graphics, statistics, quick visual insights |
| 7 | https://www.threads.net/ | Visual discussions, brand visibility, audience engagement |
| 8 | https://www.tumblr.com/ | Visual blogging, educational graphics, niche discovery |
| 9 | https://www.flickr.com/ | Image hosting, visual collections, image discovery |
| 10 | https://imgur.com/ | Shareable graphics, visual explanations, community exposure |
| 11 | https://www.tiktok.com/ | Animated infographics, short educational videos |
| 12 | https://www.youtube.com/ | Infographic videos, Shorts, visual explainers |
| 13 | https://www.snapchat.com/ | Vertical infographics, mobile-first visual stories |
| 14 | https://www.behance.net/ | Infographic portfolios, professional design projects |
| 15 | https://dribbble.com/ | Original infographic designs, visual portfolio exposure |
| 16 | https://www.deviantart.com/ | Creative infographics, illustrations, visual artwork |
| 17 | https://500px.com/ | Photography-led visual projects; limited fit for standard infographics |
| 18 | https://www.artstation.com/ | Illustrated data graphics, creative visual portfolios |
| 19 | https://bsky.app/ | Research visuals, niche discussions, brand awareness |
| 20 | https://mastodon.social/ | Community-based infographic sharing and discussion |
| 21 | https://medium.com/ | Embed infographics in articles, research summaries and guides |
| 22 | https://www.blogger.com/ | Infographic blog posts and educational content |
| 23 | https://wordpress.com/ | Publish original infographics with supporting articles |
| 24 | https://www.slideshare.net/ | Convert infographics into business presentations and slide decks |
| 25 | https://www.scribd.com/ | Distribute infographic reports and longer documents |
| 26 | https://issuu.com/ | Publish infographic PDFs, catalogs and visual reports |
| 27 | https://flipboard.com/ | Curate and distribute infographic articles by topic |
| 28 | https://wakelet.com/ | Create shareable collections of industry infographics |
| 29 | https://www.scoop.it/ | Curate industry resources and visual research |
| 30 | https://www.pearltrees.com/ | Organize related infographics into resource collections |
| 31 | https://www.quora.com/ | Answer relevant questions using supporting infographics |
| 32 | https://telegram.org/ | Distribute infographics through channels and communities |
| 33 | https://www.whatsapp.com/ | Share visual updates with subscribers |
| 34 | https://discord.com/ | Share educational graphics in relevant communities |
| 35 | https://github.com/ | Publish technical diagrams, data visualizations and source files |
Niche Infographic Submission Sites
| Sr No | Niche Infographic Submission Site | Best Use Case |
|---|---|---|
| 1 | https://visual.ly/ | Marketing, business, statistics and data storytelling |
| 2 | https://infographicjournal.com/ | Business, marketing, technology and educational infographics |
| 3 | https://www.infographicsarchive.com/ | Educational and industry-specific infographics |
| 4 | https://www.dailyinfographic.com/ | Business, science, lifestyle and data-driven visuals |
| 5 | https://coolinfographics.com/ | Data visualization, research and business insights |
| 6 | https://elearninginfographics.com/ | Education, e-learning and training |
| 7 | https://www.visualistan.com/ | Technology, social media and marketing infographics |
| 8 | https://graphs.net/ | Charts, statistics and data visualization |
| 9 | https://submitinfographics.com/ | General infographic promotion |
| 10 | https://infographicbee.com/ | General infographics and visual content |
| 11 | https://www.infographicportal.com/ | Business, technology and educational visuals |
| 12 | https://infographicreviews.com/ | Infographic showcases and visual discovery |
| 13 | https://infogram.com/ | Interactive charts and statistical reports |
| 14 | https://public.tableau.com/ | Business intelligence and interactive data visualization |
| 15 | https://www.behance.net/ | Branding, design and professional infographic portfolios |
| 16 | https://dribbble.com/ | UI/UX, SaaS and design-focused infographics |
| 17 | https://www.slideshare.net/ | B2B, sales, marketing and industry presentations |
| 18 | https://issuu.com/ | Industry reports, digital publications and infographic PDFs |
| 19 | https://www.pinterest.com/ | Real estate, finance, food, marketing and lifestyle graphics |
| 20 | https://www.flickr.com/ | Infographic images and visual collections |
| 21 | https://www.reddit.com/r/Infographics/ | General infographics and visual explanations |
| 22 | https://www.reddit.com/r/dataisbeautiful/ | Statistics, economics, finance and data visualization |
| 23 | https://medium.com/ | SaaS, marketing, finance, business and technology articles |
| 24 | https://github.com/ | Technical diagrams, developer documentation and open-source visuals |
| 25 | https://commons.wikimedia.org/ | Educational, scientific and appropriately licensed diagrams |
| 26 | https://www.datawrapper.de/ | Journalism, statistics and interactive charts |
| 27 | https://flourish.studio/ | Interactive charts, maps and data storytelling |
| 28 | https://observablehq.com/ | Technical, scientific and interactive data visualizations |
| 29 | https://www.kaggle.com/ | Data science, machine learning and analytics visuals |
| 30 | https://www.canva.com/ | Create infographics for marketing and social media distribution |
Tips on how to create a good infographic
Define Your Objective
Always state the purpose of your infographic before you begin the design process. To what extent do you want to inform or convince your audience or just make them laugh? Knowing the goal will help you decide what design and what content to include.
Research and Gather Data
Gather all the facts that are precise and appropriate to make the infographic worthwhile. To be more credible, ensure that you make use of credible sources and ensure that all your information has been well verified.
Choose a Design Tool
Choose a graphic design tool that you need for your project. Some of the alternatives include Adobe Illustrator, Canva, and Easel. ly. These tools have a variety of templates and settings that can help in designing good-quality infographics.
Design with Clarity
They are clean and devoid of any unnecessary information; hence, the design of the cards should be the same. It is advisable to reach the audience through well-written headlines, brief and to-the-point text, and high-quality visuals. Make sure that the appearance meets your company’s personality and messaging.
Include a Call-to-Action
It is necessary to insert a call to action (CTA) within an infographic. Whether it is about guiding the viewers to the website, pointing to share, or even subscribing to a newsletter, a CTA can spur action.
How to Submit an Infographic: Step-by-Step
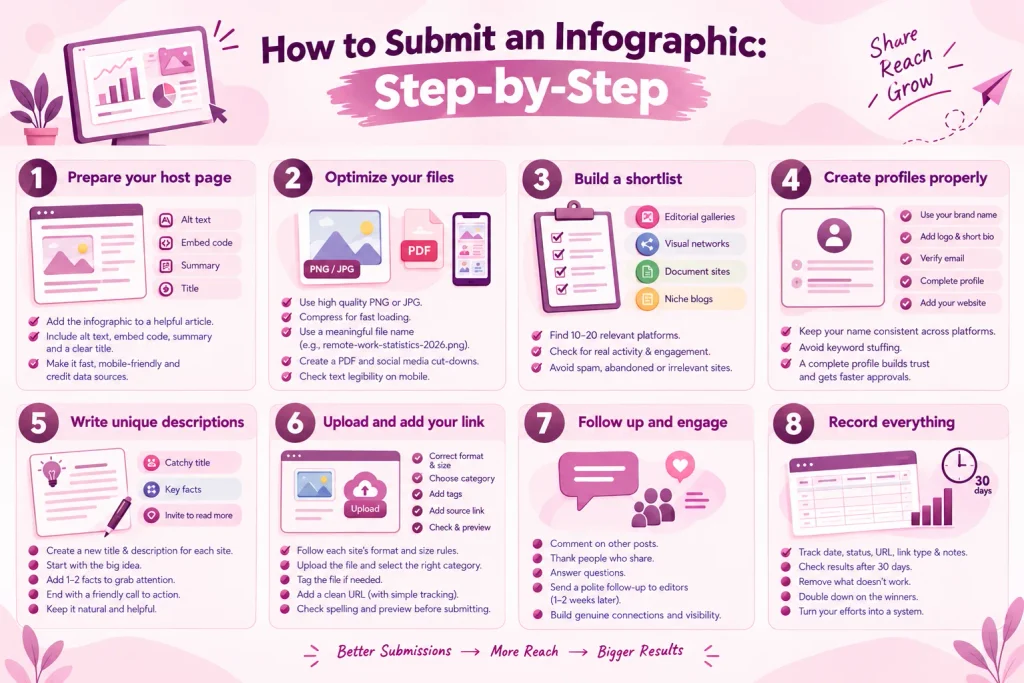
Step 1: Prepare your host page
Make the infographic available on your site within a helpful article. Include an alt text box and embed code box, a short summary and a descriptive title for easy sharing. This is the page you want all the links to be directed to. Ensure that it loads quickly and is mobile-friendly and properly acknowledges data sources.
Step 2: Optimize your files
Export at a high quality level in PNG or JPG format and compress to load quickly without losing clarity. Use a meaningful name for the file, like “remote-work-statistics-2026.png. Additionally, make a PDF version for document systems and some cut bits for social posts. Before proceeding, verify the text is legible on a cell phone screen.
Step 3: Build a shortlist
Review between 10 and 20 platforms for your topic – and not hundreds. Divide them into categories: editorial galleries, visual networks, document sites and niche blogs. Look for any new activity, real interaction and rules at each location. Don’t hesitate to avoid sites that appear to be abandoned, spammed, or to have other listings that have nothing to do with your business.
Step 4: Create profiles properly
Sign up using a consistent brand name, logo and short bio. Check your email, and fill in any profile details and add your site! It appears genial to moderators and visitors as complete profiles. Avoid keyword-stuffed usernames. A real, brand name presence facilitates your submissions being accepted quickly, and also safeguards your account from computer system spammers.
Step 5: Write unique descriptions
Develop a new title and description for each platform. Begin with the big idea, include one or two facts that will catch the reader’s attention, and conclude with an invitation to read a more detailed version. Remain natural and helpful. Finding the same text in multiple listings will make your listings look weak and can cause search engines to deem them duplicate.
Step 6: Upload and add your link
Use the format and size requirements of each site. Upload the file, make sure you choose the right category, tag the file if needed and put the source link in the appropriate place. Try to have a clean URL – preferably with simple tracking parameters – that links to your host page. Check spelling and preview before submitting.
Step 7: Follow up and engage
Once you’ve submitted, comment on other posts, thank those who share, and answer others questions. If you’re going to follow a polite letter to an editor in a gallery, do it 1-2 weeks after. A genuine interest signal and boosts visibility in your community. It also establishes connections with editors who might be interested in publishing your future work.
Step 8: Record everything
Record in your tracking sheet date, status, URL, type of link and notes. Check the platforms after 30 days, to see if they got you visits or mentions. Eliminate the ones which did not win and double down on the winners. This habit resolves “flying by the seat of your pants” into a system.
Infographic Submission Checklist and Tracking Sheet
Pre-submission checklist
- Infographic hosted on your site with an embed code.
- Clear naming and linking of data sources.
- File compressed and sized for each platform.
- Written alt text, title and description.
- PDF and social sized versions prepared.
- The branding and URL is included in the footer of the design.
- Individual description for each platform.
- Tracking parameters added to links.
Sample tracking sheet (copy into Google Sheets or Excel)
| Date | Platform | Cost | Submission URL | Status | Link Type | Approx. DR | Visits (30 days) | Notes |
| 2026-10-01 | Free | pinterest.com/… | Live | Nofollow | 90+ | 120 | Strong saves | |
| 2026-10-02 | Editorial gallery | Free | example.com/… | Pending | Unknown | 45 | 0 | Follow up in 7 days |
| 2026-10-03 | SlideShare | Free | slideshare.net/… | Live | Nofollow | 90+ | 35 | Added PDF deck |
| 2026-10-05 | Niche blog | Paid | example.org/… | Live | Sponsored | 55 | 80 | Disclosed placement |
Columns worth adding: Contact name, follow up date, anchor text used, and if it was indexed in Google.
Your 30-day action plan
- Week 1: Complete the design, publish the host page, prepare all required file sizes.
- Week 2: Make social teasers and submit to your favourite visual and document platforms.
- Week 3: Individual outreach to editors and bloggers, and reply to all comments.
- Week 4: Reflect on GA4, Search Console, Ahrefs, update sheet & brainstorm infographic plan.
Common Mistakes That Get Infographics Rejected
- Poor design: Editors bounce; they do not read if pages are cluttered, text is tiny, and colors conflict.
- Inaccurate or non-existent sources: Unreliable statistics and one of the most common rejection causes.
- Wrong category or topic: If you post a finance chart to a parenting gallery, then no one’s time is going to be wasted.
- Duplicate content: When the same description is repeated with the same text on different platforms, it looks lazy and can cause duplicate content filters.
- Too large or unreadable files: Large files take time to load, and blurry files are unconvincing.
- Excessive exact match anchor text: Using repeated exact match anchor text sounds like spamming.
- Neglecting rules: Each site has size, format and content rules. If you don’t take them, you will be refused.
- Old data: Data from several years back sounds like stale data. Use the latest/available number, if possible.
- Mass submission at spammy websites: Bad directories can cause more damage than good.
- No follow-up or engagement: Sticking one’s head in the sand after publishing posts is a missed opportunity to get attention for the posts.
How to Measure Results (GSC, GA4, Ahrefs)
Google Search Console (GSC)
- Monitor impression and clicks to the host page in the Performance report.
- Check to see if your infographic has come up in image search.
- Check the page URL to ensure that it is correctly indexed.
- Check the Links report to identify new external links as time goes by.
Google Analytics 4 (GA4)
- To view traffic by source and medium, open Reports then click Acquisition.
- Use UTM parameters to separate Pinterest, Reddit, newsletters and galleries.
- Monitor engagement duration and other metrics such as downloads, embed code copies and sign-ups.
- Analyze monthly referral traffic and identify the winners.
Ahrefs
- See new and lost links using Site Explorer and Backlinks report.
- To ensure that dofollow listings pass link equity, use the dofollow filter.
- Before going to editors, check DR and traffic before you link domains.
- Create notifications for when your brand or infographic title is mentioned.
Simple success metrics
- Referral visits and engaged sessions.
- The amount of backlinks pointing to a website that have a relevant and indexed tag.
- Branded search growth.
- Shares, saves and embeds socially.
- Leads or Sales attributed to Infographic page.
Conclusion
In 2026, the key to infographic promotion is to be patient, relevant and quality. The top Infographic Submission Sites are no longer those with the longest lists or the lowest price tag, but those that are concerned with your subject. The reach you get from free visual platforms is what you get, the editorial galleries and niche blogs offer an improved opportunity to get real links, and paid placements only work when they are clearly and honestly paid.
Start small. Make a memorable infographic, host it properly, select your top 10 platforms and monitor all outcomes. Analyze and learn from the data, revise the next design and repeat. The more you do this, the more the infographic will become a long-term asset that continues to generate traffic, mention and authority to your brand.
More Like this:
- Video Submission Sites
- Article Submission Sites
- Social Bookmarking Sites
- Classified submission Sites
FAQs
What is an infographic submission site?
They are sites and platforms that you upload an infographic to, including a title and description, and link to promote it and get it seen and may get backlinks.
Are infographic submission websites free?
There are a number of free ones, particularly the visual and document platforms. There are editors and promotion services that will cost you money for their quicker review or their preferred placement.
Does anyone know where to get dofollow links from infographic submission websites?
Some do, but most major do not use nofollow. The most likely links to be followed are those that appear in editorial galleries or in niche blogs.
Do infographic submission sites still work in 2026?
Yes, if it is used for promotion and relevance in terms of not spam building links. Placements of good quality still generate traffic, mentions and sometimes even editorial links.
How big do you need an infographic to be submitted?
It’s safe to use a width of 800 to 1,000 pixels and a compressed file size of less than 2MB. Please check the limits of each platform.
What are some of the best infographic websites to submit?
Try to target 10 to 20 platforms relevant to your infographic. To be safe and effective, remember to concentrate on fit and quality rather than volume.
Do paid infographic sites work?
Real exposure on trusted sites with clear disclosure is only attainable with real payment. Don’t look for any services that offer a promise of dofollow links.
What is the turnaround for the approval?
On open platforms like Pinterest or Imgur, instant and on editorial galleries and blogs anywhere from a few days to two weeks.
